Phasor diagrams are a graphical representation of the magnitude and directional relationship between two or more alternating quantities. In this article, we will learn about phasor and phasor diagram class 12. So let’s get started…
What are phasors?
A phasor is a rotating vector representing a sinusoidally varying quantity, such as an alternating current or an alternating voltage.
It rotates about the origin in an anticlockwise direction with a constant angular velocity $\omega$. A phasor representation is an easy way to reduce the complexity of handling single-frequency circuits.
What is a phasor diagram?
Phasor diagrams represent a graphical representation, plotted on a coordinate system, of the phase relationship between voltages and currents in passive components or an entire circuit. Phasors are generally defined relative to a reference phasor, which always points to the right along the x-axis.
There can be a phase difference between sinusoidal waveforms of the same frequency, which represents the angular difference between the two sinusoidal waveforms. Also, the terms “leading” “lagging” “in phase” and “out of phase” are commonly used to indicate the relationship of one sine waveform to another.
The generalized sine expression is given as follows: $$A_{(t)}=A_m\sin({\omega t\pm\phi)}$$ It represents the sinusoid in time-domain form. But when represented mathematically in this way, it can sometimes be difficult to visualize the angular or phasor difference between the two (or more) sinusoidal waveforms.
One way to overcome this problem is to graph the sinusoids within the spatial or phasor domain shape by using phasor diagrams, and this is achieved by the rotating vectors method. Basically, a rotating vector, also known as a “phase vector”, is a scaled line whose length represents an AC magnitude equal to in both magnitudes (“maximum amplitude”) and direction (“phase”), and which has ” been frozen” at some point in time.
Sometimes a vector with an arrowhead at one end, partly indicating the maximum value of the vector’s magnitude $( V_m \;\text{or} \; I_m )$ and partly indicating the end of the rotating vector.
Vectors are generally assumed to pivot at one end about a fixed zero point known as the “origin point”. The tail of the arrow represents the amount freely rotating with an angular velocity ( ω ) counterclockwise. This counter-clockwise rotation of the vector is considered positive rotation.
Likewise, a clockwise rotation is considered a negative rotation. Magnitude and direction, the main difference between the two is that the magnitude of a vector is the “peak” value of the sine wave while the magnitude of the phasor complex is the “RMS value” of the sine wave since these are AC circuits which have reactance.
In both cases, the phase angle, direction, and angular velocity remain the same. Phasor diagrams can represent the phase of an alternating quantity at any point in time. Therefore, phasor diagrams can be viewed as “functions of time”.
A full sine wave can be constructed by a single vector rotating counterclockwise with an angular velocity of $\omega = 2\pi f$, where f denotes the frequency of the waveform. So a phasor is a quantity that has both “magnitude” and “direction”.
Furthermore, vectors obey the parallelogram law of addition and subtraction, so they can be added to produce a vector sum that rotates counterclockwise with angular velocity. Phasors, on the other hand, represent the mathematical forms: rectangular, polar, or exponential. For example $(a + jb)$.
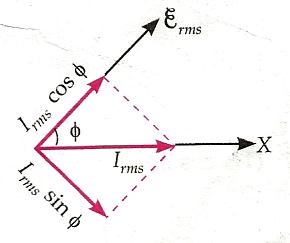
Therefore, the phasor notation defines the effective magnitude (RMS value) of voltages and currents. In general, when creating a phasor diagram, the angular velocity of a sine wave is always taken as ω in rad/sec. Consider the following phasor diagram.
Read Also
- Derive an expression for the average or mean value of AC for half cycle
- Alternating current class 12 – amplitude, time period, frequency
Phasor diagram for a sinusoidal waveform

As the single vector rotates counterclockwise, its apex at point A rotates a complete revolution of 360° or 2π, which is a complete cycle. If the length of its moving tip is transmitted in time for different angular intervals, a graph like the one shown above would draw a sinusoidal waveform, starting from the left with time zero.
Each position along the horizontal axis indicates the time elapsed from time zero, t=0. When the vector is horizontal, the apex of the vector represents the angles at 0°, 180°, and at 360°. When the peak of the vector is vertical, it represents the positive peak (+Am) at 90° or π/2 and the negative peak (-Am) at 270° or 3π/2.
The timeline of the waveform then represents the angle in degrees or radians that the pointer has moved. So we can say that a phasor represents a scaled voltage or current value of a rotating vector that is “frozen” at some point. time (t) and in our example above this is an angle of 30°.
Sometimes when analyzing alternating waveforms. We may need to know the position of the phasor representing the alternating magnitude at a certain point, especially when we want to compare two different waveforms on the same axis. For example voltage and current.
We have assumed in the waveform above that the waveform starts at time t=0 with a corresponding phase angle in degrees or radians. However, if a second waveform starts to the left or right of this zero point, and if we want to represent it in phasor notation, then for the relationship between the two waveforms, we must consider the phase difference $\phi$ of the waveform oscillation. Consider the following diagram.
Phase Difference of a Sinusoidal Waveform

The generalized mathematical expression to define two sinusoidal quantities is given as follows: $$V_{(t)}=V_m\sin({\omega t)}$$ $$I_{(t)}=I_m\sin({\omega t -\phi)}$$ The current $I$ lags the voltage $V$ by the angle $\phi$ and in our example above this is 30°. So the difference between the two phasors representing the two sinusoidal quantities is the angle $\phi$ and the resulting phasor diagram will be.
Phasor Diagram of a Sinusoidal Waveform

The horizontal axis draws the phasor diagram according to time zero (t = 0). The lengths of the phasors are proportional to the values of voltage (V) and current (I) at the time the phasor diagram is drawn.
The current phasor lags the voltage phasor by the angle $\phi$, since the two phasors rotate counterclockwise as stated above, the angle $\phi$ is therefore also measured counterclockwise.
However, if the waveforms were frozen in time, t = 30°, the corresponding phasor diagram would look like the one shown below. Again, the current phasor lags behind the voltage phasor because the two waveforms have the same frequency.

However, since the current waveform is now crossing the horizontal zero-axis line at that moment, we can use the current phasor as our new reference and correctly say that the voltage phasor “leads” the current phasor by the angle Φ. In any case, one phasor is called a reference phasor and all other phasors will either lead or lag behind that reference.
Read Also
- Expression for the RMS value of alternating current for a full cycle
- Expression for the RMS value of an alternating EMF
Frequently Asked Questions – FAQs
What is the phasor and phasor diagram Class 12?
Phasor diagrams are representations of the voltage-current relationships in AC circuits. A phasor is a vector capable of rotating about the origin with (angular velocity) ‘ω’. The vertical component of the phasor will represent the sinusoidally varying quantity.
What is the concept of phasor?
A phasor is a rotating vector representing a quantity, such as an alternating current or voltage, that varies sinusoidally. A phasor representation is a simple way of reducing the complexities of handling single-frequency circuits.
What is the difference between phasor and vector?
A vector is a physical quantity that has both magnitude and direction (x, y, z; or polar coordinates). A phasor is a mathematical quantity created in electronics to explain AC behavior; it has magnitude and phase (units in degrees or radians). The phase has nothing to do with the angle in polar coordinates
Why phasor is a scalar quantity?
Phasors are complex numbers. They are scalars, although we can also define them in terms of magnitude and angle on the complex plane. Vectors are vectors. Vectors have both magnitude and direction
Why do phasors rotate anticlockwise?
For a frequency higher than the reference frequency (at which the axes are ‘frozen’, a higher frequency will be represented by a phasor that is rotating anticlockwise and vice versa because of the rate of change of phase relative to the reference.
Stay tuned with Laws Of Nature for more useful and interesting content.